How can you enable debugging mode in WordPress or get more information about WordPress errors displayed on a web browser? If you are a WordPress user or developer and are asking these questions, you have landed on the right resource. This guide will show you how to enable WordPress’s debugging features.
WordPress provides several powerful debugging tools both for developers and non-programmer or general users, that you can enable using available configuration options. These options once enabled help you quickly find and resolve errors by showing the detailed error information.
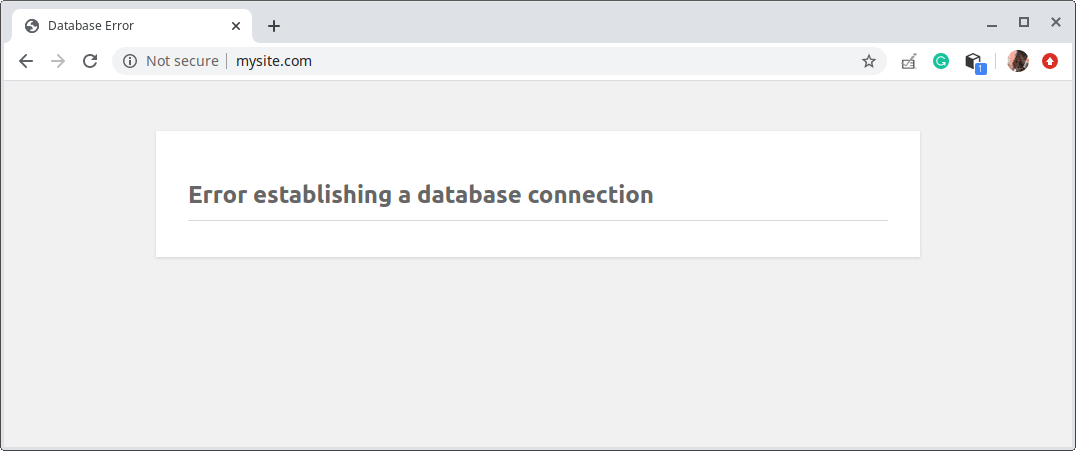
We will demonstrate using the following error which we encountered while setting up a dummy site for testing purposes.
When you look at this error, there is no much information that accompanies it. There could be many causes to it: the database server could be down or the database connection settings (i.e database name, database user, and the user’s password) defined in the wp-config.php configuration file could be wrong.
So how can we get more information about the above error? The WP_DEBUG option is a PHP permanent global variable that activates the “debug” mode throughout WordPress thus causing all PHP errors, notices, and warnings to be displayed on the browser.
This “debug” feature was added in WordPress version 2.3.1 and is configured in wp-config.php – one of the most important files in your WordPress installation.
By default, the “debug” feature is set to false in any WordPress installation. To enable WP_DEBUG, set it to true.
First, move into your websites installation directory e.g /var/www/html/mysite.com and then open the wp-config.php file using your favorite text editor.
$ cd /var/www/html/mysite.com
$ sudo vim wp-config.php
Look for this line.
define( 'WP_DEBUG', false );
and change it to
define( 'WP_DEBUG', true );
Save the file and close it.
Now debug mode has been triggered. If we reload the page that showed the error, we can see the detailed error information as shown in the following screenshot.
There are additional debug options that extend WP_DEBUG that are particularly useful for WordPress developers creating plugins or themes, or any other components. They are WP_DEBUG_LOG and WP_DEBUG_DISPLAY.
The WP_DEBUG_LOG option when set to true causes all errors to be saved to a debug.log log file inside the /wp-content/ directory by default. This is useful for later analysis or processing.
define( 'WP_DEBUG_LOG', true );
But you can specify a custom log file e.g /var/log/nginx/mysite.com_wp-errors.log:
define( 'WP_DEBUG_LOG', '/var/log/nginx/mysite.com_wp-errors.log' );
And WP_DEBUG_DISPLAY controls whether debug messages are shown inside the HTML of pages or not. By default, it is set to true. To disable it, set it to false.
define( 'WP_DEBUG_DISPLAY', false );
Enable Debug Mode in WordPress Using Plugin
If you are using shared hosting, you probably don’t have access to the server backend to edit your WordPress files in this case the wp-config.php file.
Or if you simply prefer to change settings from the admin dashboard, you can install and use a plugin called “Debug Bar” which allows you to easily enable/disable WP_DEBUG from admin dashboard with a single click on the Toolbar.
The killer feature of this plugin is that it is failsafe and clever, it automatically exits the WP_DEBUG mode in case of errors.
Reference: Debugging in WordPress.
