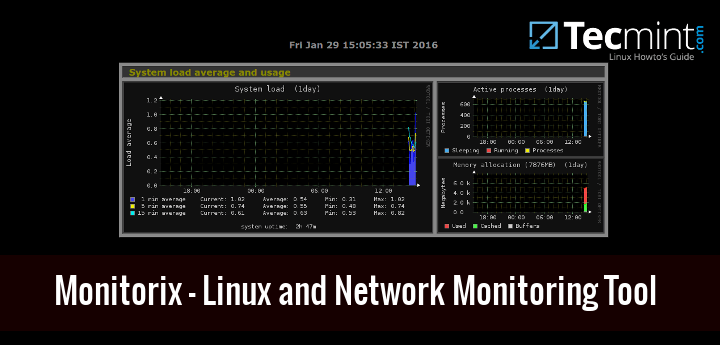
Monitorix is an open-source, free, and most powerful lightweight tool designed to monitor system and network resources in Linux. It regularly collects system and network data and displays the information in graphs using its own web interface (which listens on the port 8080/TCP). Monitorix allows for monitoring overall system performance and also helps in detecting
Monitoring Tools - DesignLinux
13 Useful Performance and Network Monitoring Tools for Linux
If you’re working as a Linux/Unix system administrator, sure you know that you must have useful monitoring tools to monitor your system performance. As monitoring tools are very important in the job of a system administrator or a server webmaster, it’s the best way to keep an eye on what’s going on inside your system.
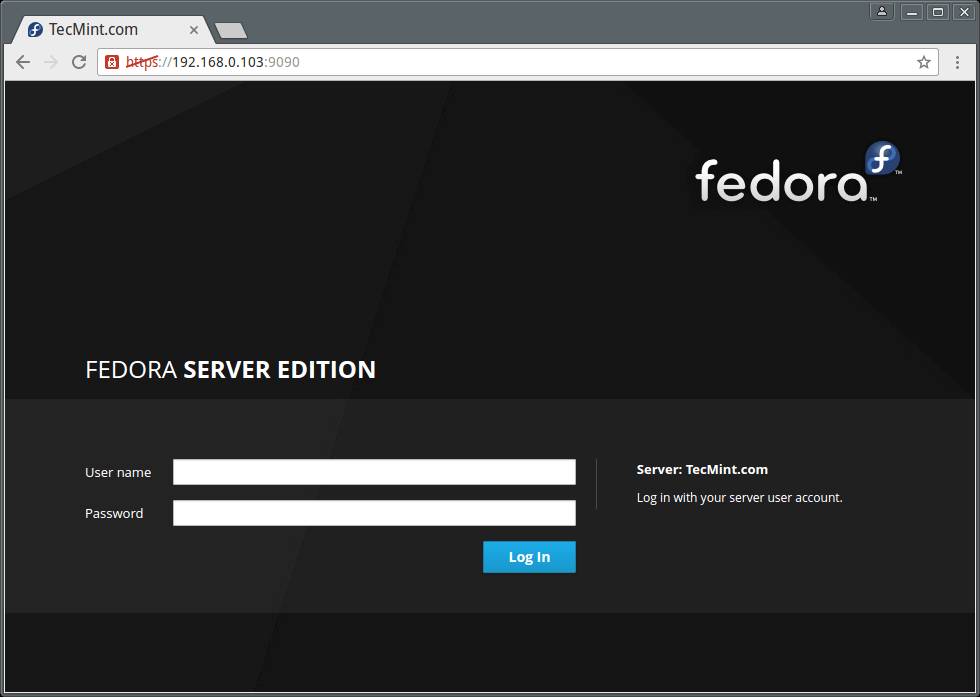
Cockpit – A Powerful Tool to Monitor and Administer Multiple Linux Servers via Browser
Cockpit is an easy-to-use, lightweight, and simple yet powerful remote manager for GNU/Linux servers, it’s an interactive server administration user interface that offers a live Linux session via a web browser. It can run on several RHEL-based Linux distributions and Debian derivatives including Ubuntu, Linux Mint, Fedora, CentOS, Rocky Linux, AlmaLinux, Arch Linux among others.
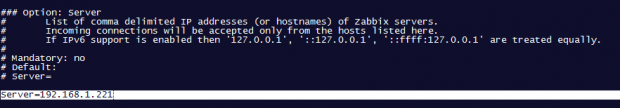
How to Install and Configure Zabbix Agents on Remote Linux – Part 3
Continuing the Zabbix series, this tutorial will guide you on how you can install and configure Zabbix agents on Linux (Debian-based systems and RHEL-based distros) in order to actively monitor local resources on remote systems. The main job of Zabbix agents consists in gathering local information from the targets where they run and sending the
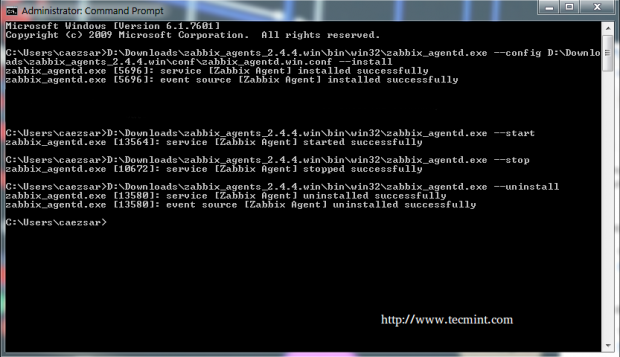
How to Install Zabbix Agent and Add Windows Host to Zabbix Monitoring – Part 4
Following previous tutorials concerning the Zabbix series, this article describes how to install and set up an instance of a Zabbix agent to run as a service on Microsoft Windows systems in order to monitor your infrastructure windows environments, especially server machines. Requirements How to Install Zabbix on RHEL/CentOS and Debian/Ubuntu – Part 1 How
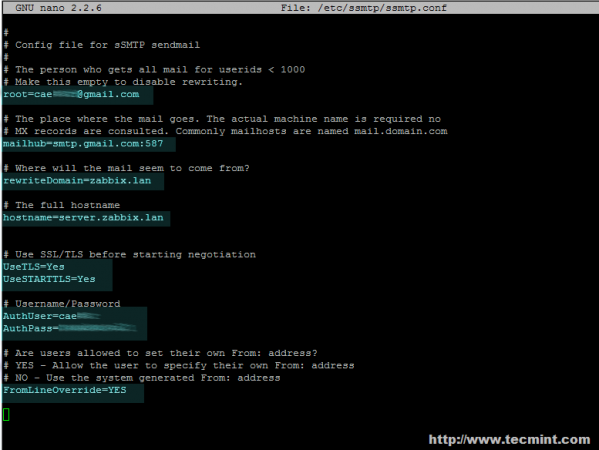
How to Configure Zabbix to Send Email Alerts to Gmail Account – Part 2
If you are using Zabbix to monitor your infrastructure you might want to receive email alerts from your local domain somewhere on a public internet domain, even if you don’t own a valid registered internet domain name with a mail server which you can configure on your own. This tutorial will briefly discuss how to
How to Install Zabbix on RHEL/CentOS and Debian/Ubuntu
Zabbix is an Open Source, high-level enterprise software designed to monitor and keep track of networks, servers, and applications in real-time. Build in a server-client model, Zabbix can collect different types of data that are used to create historical graphics and output performance or load trends of the monitored targets. The server has the ability
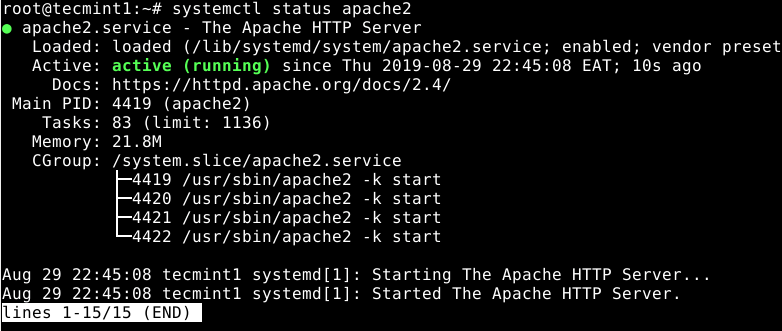
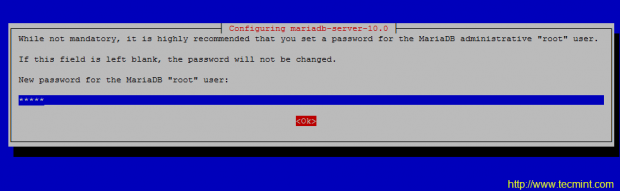
How to Install Zabbix Monitoring Tool on Debian 11/10
Zabbix is a free, open-source, popular and feature-rich IT infrastructure monitoring software developed using PHP language. It is used to monitor networks, servers, applications, services as well as cloud resources. It also supports the monitoring of storage devices, databases, virtual machines, telephony, IT security resources, and much more. [ You might also like: How to
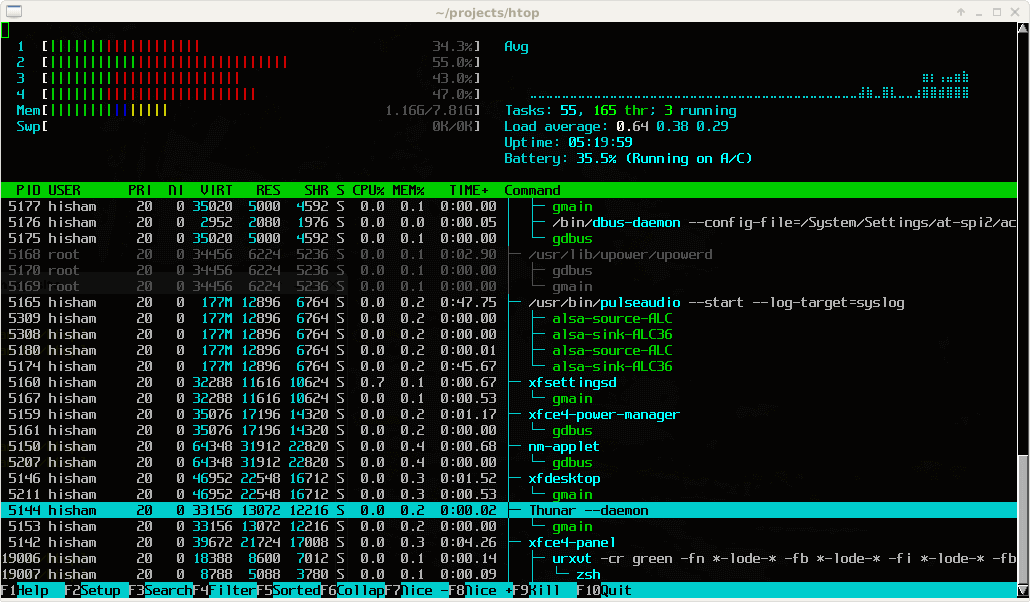
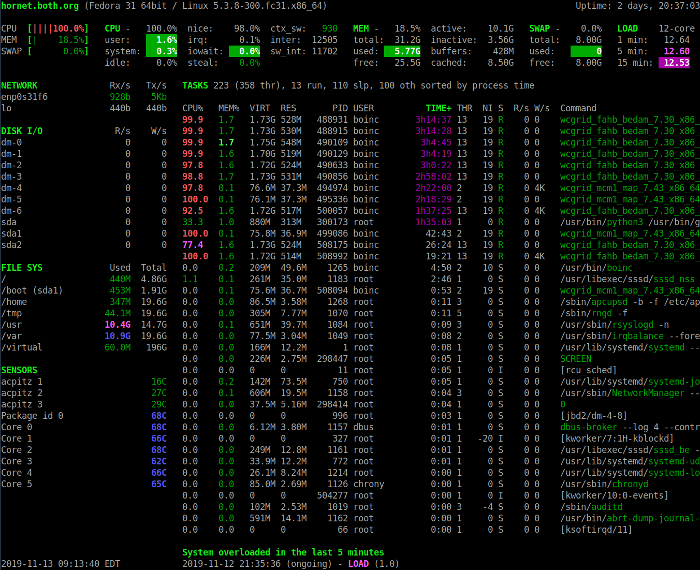
Htop – An Interactive Process Viewer for Linux
This article is the continuation of our Linux system monitoring series, today we’re talking about the most popular monitoring tool called htop, which is just reached version 3.0.5 and comes with some cool new features. Htop Linux Process Monitoring Tool Htop is an interactive real-time process monitoring application for Linux/Unix-like systems and also a handy
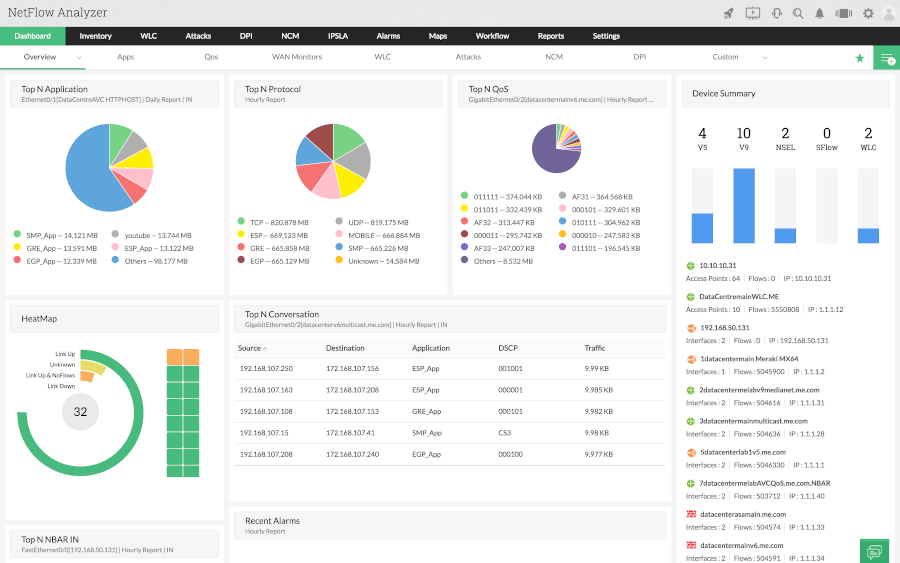
16 Useful Bandwidth Monitoring Tools to Analyze Network Usage in Linux
Are you having problems monitoring your Linux network bandwidth usage? Do you need help? It’s important that you are able to visualize what is happening in your network in order to understand and resolve whatever is causing network slowness or simply to keep an eye on your network. Read Also: 20 Command Line Tools to